Click here for a printable version
Title: Coal Production in the USA
Level: Intermediate, Middle School
Time: 2-3 Days
KERA Goals: 2.1, 2.
Objective: 1. Students will determine the leading coal producing states and calculate their productions totals. 2. Students will be able to sort the coal production data information according to alphabetical order by state and according to total tonnage per thousand short tons from highest to lowest. 3. Students will color code a map of the United States indicating coal production.
Materials:
1. Information sheet (below)
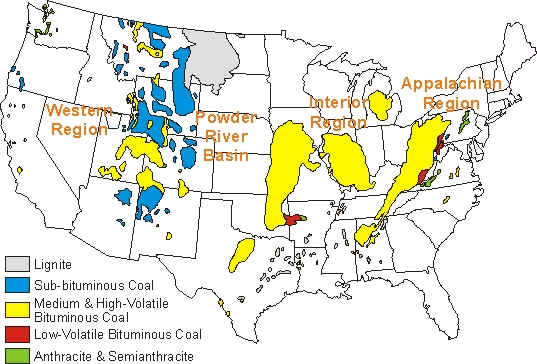
2. The map from the U.S. Department of Energy. (below) It shows where various kinds of coal (lignite, sub-bituminous, bituminous and anthracite) can be found. The chart below it shows which states mine coal and how much each produced in 1990.
3. Blank map of the United States
4. Crayons
Activity:
1. Arrange the states by alphabetical order. What is the first state listed? What is the last state? Estimate how much difference there is between the two figures.
2.. Find the top five coal producing states. What are their total production levels?
3. Find all of the states which begin with the letter "A" and whose coal production is less than 12,000 thousand short tons. Add the states totals. Is the value more, less, or equal to the sum of the totals for California and Oklahoma?
4. Based upon the map and information given, can you determine an estimate of the total number of tons of coal in the United States? . Why or why not? (Are all 50 states represented? Are there oal reserves yet untapped?)
5. Color code a map of the United States indicating coal production.

|
1989 U.S. Coal Production By State (Thousand Short Tons) | |||||
| State | Total | State | Total | State | Total |
| Wyoming | 171,558 | Kentucky | 166,472 | W. Virginia | 153,143 |
| Pennsylvania | 69,542 | Illinois | 59,246 | Texas | 53,849 |
| Virginia | 42,766 | Montana | 37,742 | Ohio | 33,525 |
| Indiana | 33,631 | North Dakota | 29,555 | Alabama | 27,888 |
| New Mexico | 23,702 | Utah | 20,099 | Colorado | 17,115 |
| Arizona | 11,935 | Tennessee | 6,367 | Washington | 5,039 |
| Missouri | 3,377 | Maryland | 3,343 | Louisiana | 2,983 |
| Oklahoma | 1,728 | Alaska | 1,582 | Kansas | 854 |
| Iowa | 427 | Arkansas | 39 | California | 41 |
|
Coal Production in the USA Answer Key | |||
| Alphabetical: | |||
| State | Total | State | Total |
| Alabama | 27,888 | Montana | 37,742 |
| Alaska | 1,582 | New Mexico | 23,702 |
| Arizona | 11,935 | North Dakota | 29,555 |
| Arkansas | 39 | Ohio | 33,525 |
| California | 41 | Oklahoma | 1,728 |
| Colorado | 17,115 | Pennsylvania | 69,542 |
| Illinois | 59,246 | Tennessee | 6,367 |
| Indiana | 33,631 | Texas | 53,849 |
| Iowa | 427 | Utah | 20,099 |
| Kansas | 854 | Virginia | 42,766 |
| Kentucky | 166,472 | Washington | 5,039 |
| Louisiana | 2,983 | West Virginia | 153,143 |
| Maryland | 3,343 | Wyoming | 171,558 |
| Missouri | 3,377 | ||
|
The first state listed is Alabama….27,888. The last state listed is Wyoming…..171,558. | |||
| The difference, 171,558 - 27,888 = 143,670, or approximately 144,000. | |||
| The top five coal producing states: | |
| State | Total |
| Wyoming | 171,558 |
| Kentucky | 166,472 |
| West Virginia | 153,143 |
| Pennsylvania | 69,542 |
| Illinois | 59,246 |
| States that start with "A" and have more than 12,000 thousand short tons: | ||
| State | Total | 13,556 > 1,769 |
| Alaska | 1,582 | |
| Arizona | 11,935 | |
| Arkansas | 39 | |
| Total | 13,556 | |
| California | 41 | |
| Oklahoma | 1,728 | |
| Total | 1,769 | |
Provided by Pittsburgh Energy Technology Center
Return to Primary Lesson Plans